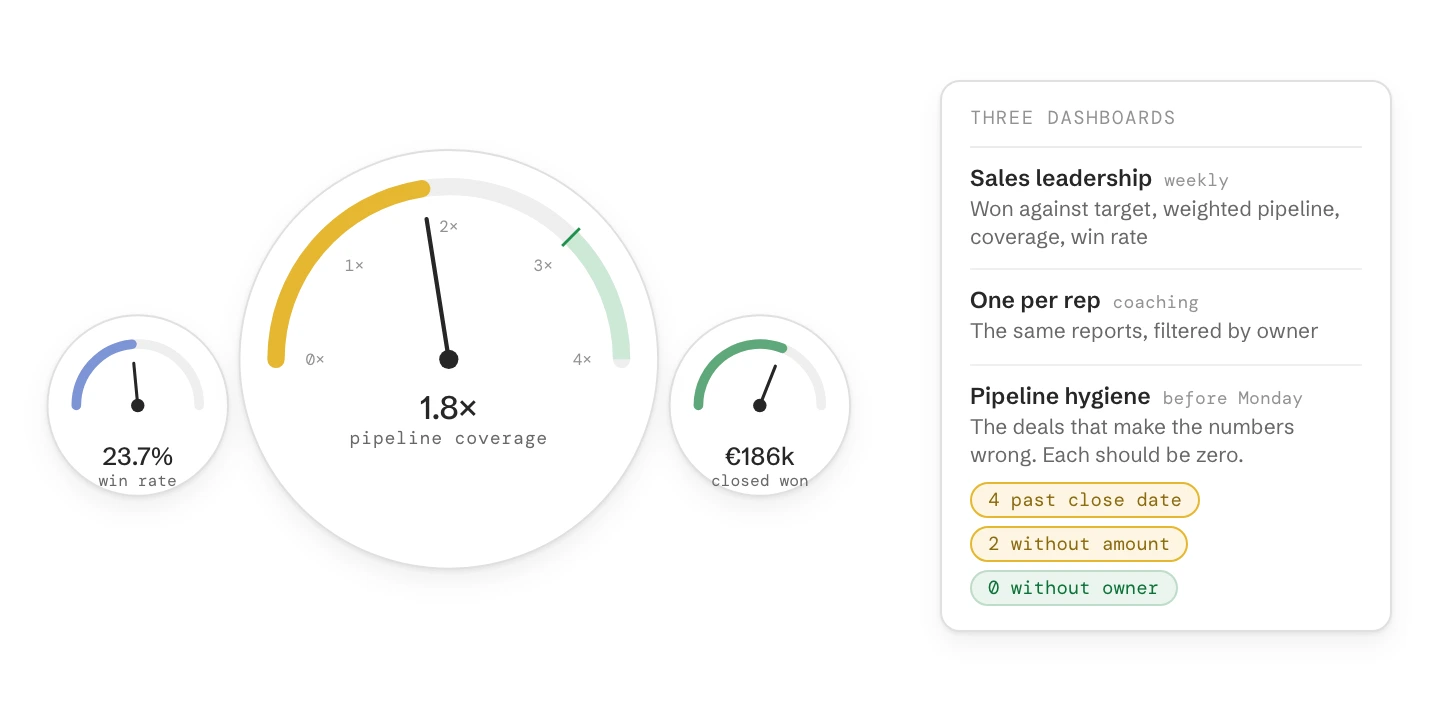
A sales leader needs ten numbers from HubSpot: revenue won against target, weighted pipeline, pipeline coverage, new pipeline, win rate, deal size, sales cycle, stage conversion, stuck deals and loss reasons. Put them on three dashboards: one for the weekly leadership meeting, one per rep, and one that lists the deals that make the numbers wrong.
Most of these reports are ready-made in HubSpot’s Sales analytics suite. Whether anyone trusts them depends on the data underneath: a close date that means the real signing date, stages everyone uses the same way, and an amount on every deal.
Dashboards
Free 10, Starter 30, Professional 75, Enterprise 100 per account, up to 50 reports each
Ready-made reports
Sales analytics suite under Reporting > Reports > Sales, from Sales Hub Starter
Own reports
Custom report builder from Professional: 100 custom reports, 500 on Enterprise
Targets
Goals and the forecast tool for quota and forecast, from Professional (Starter has revenue goals only)
Sharing
Weekly email of a dashboard to HubSpot users; no public link without a login
What breaks it
Close dates nobody updates, stages used differently by each rep, deals without an amount
Which HubSpot plan your sales reports need
Basic deal reports and dashboards work on every plan. Targets, forecasts and your own reports need Sales Hub Professional.
What you need
Free
Starter
Professional
Enterprise
Dashboards per account
10
30
75
100
Ready-made sales reports (Sales analytics suite)
No
Yes
Yes
Yes
Custom report builder and formulas
No
No
Yes, 100 custom reports
Yes, 500 custom reports
Goals (quota per rep)
No
Revenue goals only
Revenue, deals created, calls, meetings
Plus custom goals
Forecast tool
No
No
Yes
Yes, across team levels
Dashboard access by team or user
No
No
No
Yes
Limits follow the highest Hub you have. As of October 2026.
The ten numbers a sales leader needs in HubSpot
Each number answers one question in the weekly meeting. If a report doesn’t change a decision, leave it off the dashboard.
Number
How it is calculated
HubSpot report
What breaks it
Revenue won against target
Won amount with a close date in the period, divided by the rep’s goal
Quota attainment
Goals not set per rep, close date set to the day someone tidied up instead of the signing date
Weighted pipeline
Amount × stage probability, for open deals closing in the period
Open pipeline closing this quarter, divided by the target still to reach. We aim for 3 times.
Custom report with a formula, or two reports side by side
Close dates in the past still count as open pipeline
New pipeline
Deals and amount created in the period, per rep
Deals created
Grouped by who created the deal, not the owner; deals created only when a quote goes out
Win rate
Won deals divided by won plus lost, by count and by amount
Deals won and lost
Lost deals left open instead of closed as lost
Average deal size
Average amount of won deals
Average deal size
Deals without an amount, or amounts with and without VAT mixed
Sales cycle
Days from create date to close date, for won deals
Deal velocity
Deals created at signing make the cycle look short
Stage conversion
Share of deals that reach the next stage
Deal funnel
Stages skipped or used differently by each rep
Stuck deals
Open deals past their close date, or with no activity for 14 days
A saved deal view or a deal report with filters
Close dates pushed every week without a reason
Why deals are lost
Lost deals and amount per loss reason
Deal loss reasons
The loss reason is free text, so every rep writes it differently
The ten sales numbers: formula, HubSpot report and what breaks each. Report names as in HubSpot’s Sales analytics suite, October 2026.
Three sales dashboards to set up in HubSpot
The leadership meeting needs team totals and the coaching talk needs one rep’s deals, so each gets its own dashboard. A third lists the data to fix before either meeting.
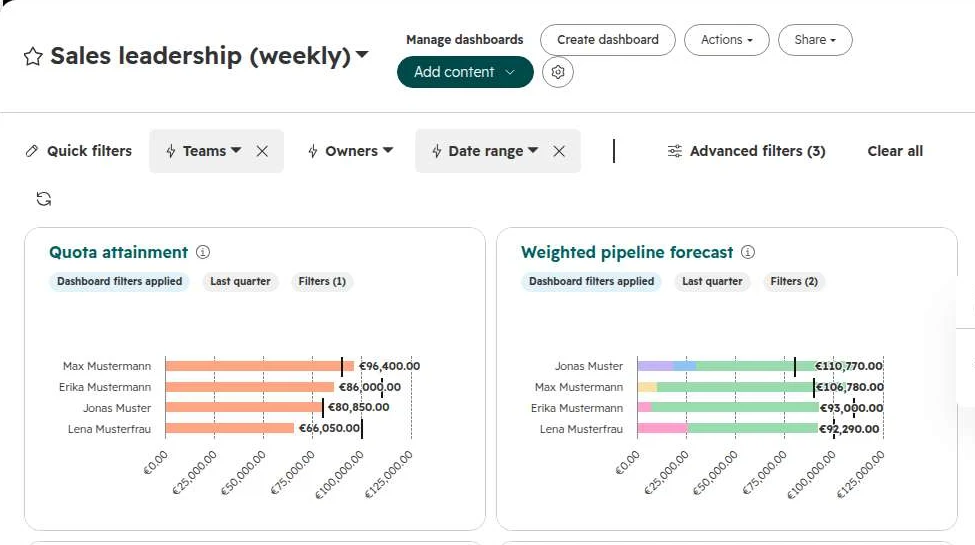
Sales leadership, weekly. Revenue won against target, weighted pipeline, coverage, new pipeline, win rate and loss reasons, for the whole team. Filter by team and by quarter. Everyone may view it, only the head of sales edits it.
One per rep. The same reports, filtered by owner: their won revenue against their goal, their open deals, their stage conversion and their stuck deals. In the coaching talk, look at conversion between stages first, then activity.
Pipeline hygiene, before the meeting. The deals that make the other two wrong: open deals past their close date, open deals without an amount, deals without an owner, lost deals without a reason. Every number here should be zero, and each rep fixes their own deals before Monday.
The weekly leadership dashboard, filtered to the sales team and the last quarter.
How to build a sales dashboard in HubSpot
Build the dashboard from the ready-made sales reports first. Turn to the custom report builder only for what they don’t cover.
Step 01
Create the dashboard
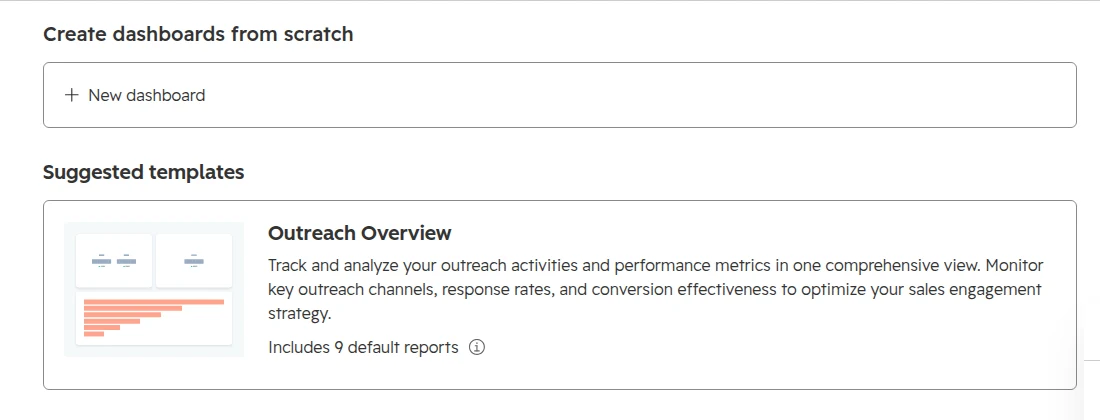
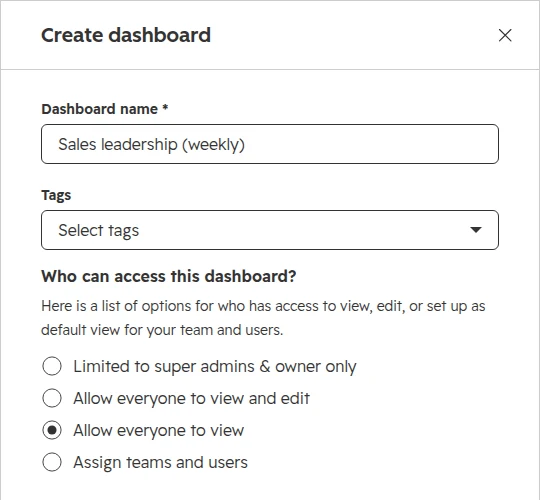
Go to Reporting > Dashboards and click Create dashboard. Pick a template from the library or start with New dashboard. Name it after the meeting it serves, for example “Sales leadership (weekly)”, and choose who may see it. “Allow everyone to view” lets the team look without changing anything.Start from a template or a blank dashboard.Name and access for the new dashboard.
Step 02
Add reports from the Sales analytics suite
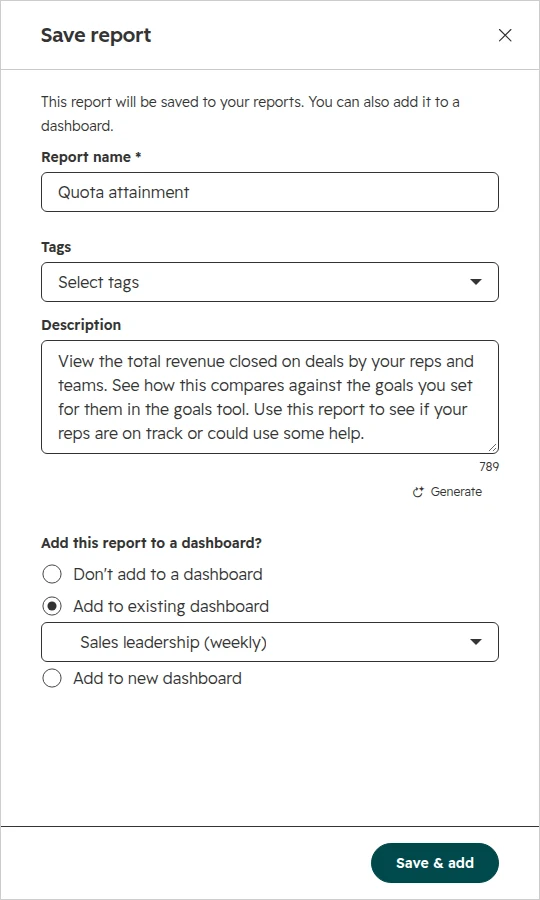
Go to Reporting > Reports and open Sales under Analytics suites. Open a report, for example Quota attainment, set the filters and click Save report. Choose “Add to existing dashboard” and pick your dashboard. Repeat for each of the ten numbers.Saving a ready-made report straight to the dashboard.
Step 03
Check what each report groups by
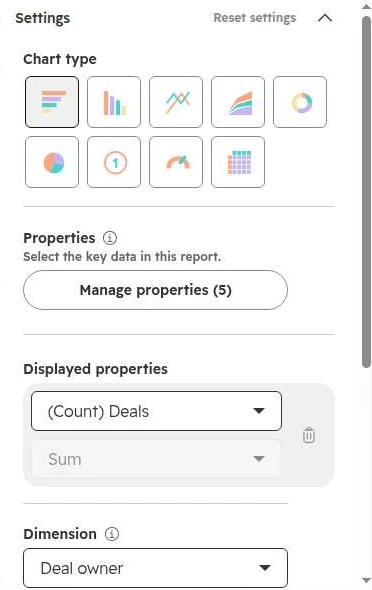
Open each report on the dashboard and look at Dimension in the settings. The ready-made Deals created report groups by who created the deal, so every deal from an import or an integration lands on one person. Switch it to Deal owner and save with “Update existing report”.Deals created, grouped by deal owner instead of the creator.
Step 04
Add quick filters
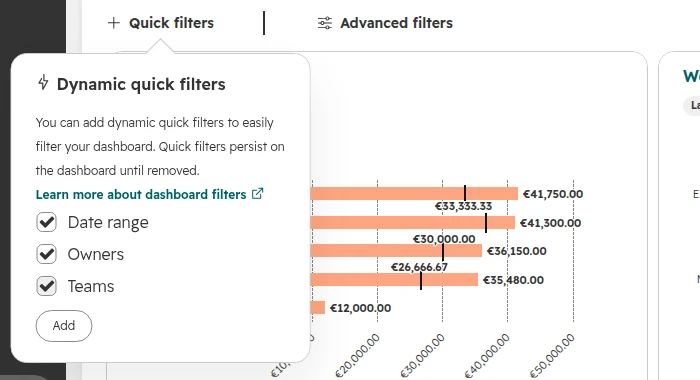
Click Quick filters on the dashboard and add Date range, Owners and Teams. Set the team and the period once, and every report that uses deal data follows. Sales analytics reports such as Quota attainment and Weighted pipeline forecast keep their own date range, so set the period in those reports too.Date range, Owners and Teams as quick filters on the dashboard.
Step 05
Send it every Monday
Click Share > Email this dashboard, choose “Yes, this is a recurring email”, and send it weekly to the people in the meeting. Recurring emails only go to HubSpot users, and they show the data the sender may see. If each rep should get only their own numbers, each rep sets up their own email.
Get the data right before the dashboard
A dashboard only adds up what reps enter. Settle these deal fields and rules before you build it.
Close date means the expected signing date. While the deal is open, the rep keeps it current. Once the deal closes, the close date is the signing date, even if someone updates the deal weeks later.
Amount on every deal, net, in one currency rule. Amounts are without VAT. Decide whether they are one-off or annual. Closed won deals keep the exchange rate of the day they closed, open deals use today’s rate.
Each stage has a written exit rule. “Proposal sent” means the proposal went out, not that the customer asked for one. Make the fields a stage needs required when a deal moves into it, under the pipeline’s stage settings.
Loss reason as a dropdown. HubSpot’s Closed lost reason is free text by default. A dropdown with five to eight reasons makes the loss report readable.
One pipeline per sales process. Regions and teams are filters. Separate pipelines only where the stages really differ.
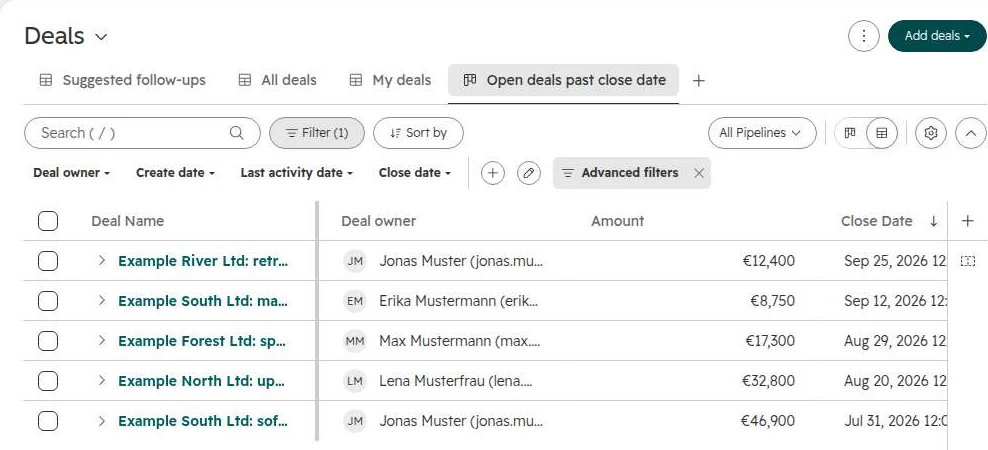
Then make the hygiene list part of the week. A saved deal view with open deals past their close date takes a rep five minutes on Friday, before the Monday meeting.
A saved view of open deals whose close date has passed. Every row is a deal to update or close.
Why HubSpot reports and the sales team disagree
When a rep says “that number is wrong”, the report usually adds up the data correctly and the deal data is out of date. Check these seven causes.
Different date property. One report counts by create date, the other by close date. “Deals this quarter” means two different things.
Contacts instead of deals as the source. A report built on contacts counts a deal once per contact. Revenue numbers always come from deals.
Weighted or not weighted. The weighted pipeline multiplies each amount by its stage probability. The weighted total is always lower than the sum of open amounts.
Your own filters. Filters a viewer adds on a dashboard apply only for that viewer, unlike the quick filters its owner sets. A colleague with the same dashboard may see different numbers.
Permissions. Users who may only see their own or their team’s deals see smaller totals on the same report.
Lost deals left open, or deleted. An old deal still open inflates the pipeline. A deleted deal disappears from the win rate.
A definition changed. When a stage or a property gets a new meaning, older deals still carry the old one. Note the date of the change next to the report.
What HubSpot sales reports can’t do, and the workaround
Most HubSpot reports show the pipeline as it is now. Four common requests need a workaround.
You want
Why HubSpot can’t
Workaround
The pipeline as it looked last Monday
Reports read current values
The Historical snapshots and Deal change history reports in the Sales analytics suite
A dashboard on a screen in the office
Every dashboard needs a HubSpot login
A user for the screen, or a scheduled email with the dashboard
The weekly email for the managing director without a seat
Recurring emails only go to HubSpot users
A free view-only user, or a one-time email to a verified domain (Professional and up)
The board deck
Dashboards have no narrative
Export the reports and write the story; keep the definitions on one page so the numbers match
As of October 2026.
Per-rep reports and the works council
A dashboard per rep shows how each person works. In Germany and Austria, agree on it before you switch it on.
Germany. Software that can monitor how employees work needs the works council’s agreement (section 87(1) no. 6 BetrVG). Reports of activity or results per rep fall under it.
Austria. Systems that process employees’ personal data beyond the basics need a works agreement (section 96a ArbVG).
What helps. Agree which reports show individual reps, who sees them and what they are used for. Team totals for the leadership meeting, individual numbers only in the rep’s own dashboard and in coaching.
How we set up sales reporting
We start with the weekly meeting: which decisions it takes and which numbers it needs for them.
Step 01
Agree the definitions
What counts as pipeline, when a deal counts as won, which date and which amount. One page, signed off by sales and finance.
Step 02
Fix the data
Required fields per stage, loss reasons as a dropdown, owners on every deal, and a clean-up of old open deals.
Step 03
Build the three dashboards
Leadership, per rep and hygiene, from the ready-made reports first, with quick filters and a weekly email.
Step 04
Check after four weeks
Which reports the meeting used, and which numbers still caused arguments.
Frequently asked questions
What is a HubSpot dashboard?
A HubSpot dashboard is one page of up to 50 reports that share quick filters, such as date range, owner and team. Every plan includes dashboards, from 10 on the free CRM.
What should a HubSpot sales dashboard include?
A HubSpot sales dashboard should show ten numbers: revenue won against target, weighted pipeline, pipeline coverage, new pipeline, win rate, average deal size, sales cycle, stage conversion, stuck deals and loss reasons. Split them across a weekly leadership dashboard, one dashboard per rep and a pipeline hygiene dashboard.
Is HubSpot reporting free?
Dashboards and basic reports are included in every plan, with 10 dashboards on the free CRM. The ready-made sales reports need Sales Hub Starter, and the custom report builder, goals and the forecast tool need Professional.
How many dashboards can I have in HubSpot?
HubSpot allows 10 dashboards on Free, 30 on Starter, 75 on Professional and 100 on Enterprise per account, each with up to 50 reports. The limit follows the highest Hub you have.
Can I share a HubSpot dashboard with someone who has no login?
Not as a live link: every HubSpot dashboard needs a login. You can send a dashboard once by email to an address on a verified domain (Professional and up), or create a free view-only user for that person.
Why don’t my HubSpot report numbers match?
HubSpot reports usually disagree because they use different date properties, different sources (contacts instead of deals), weighted versus unweighted amounts, or different permissions. Compare the report settings before you compare the numbers.
Can I build a sales dashboard on Sales Hub Starter?
Yes. Sales Hub Starter includes the Sales analytics suite and revenue goals. You can’t build custom reports or use the forecast tool, so pipeline coverage needs two reports side by side.
How do I create a sales report in HubSpot?
Go to Reporting > Reports, open Sales under Analytics suites, pick a ready-made report such as Quota attainment, set the filters and click Save report. Reports the suite doesn’t cover need the custom report builder, which starts on Professional.
How do I report on quota in HubSpot?
Set a revenue goal per rep under Goals, then add the Quota attainment report from the Sales analytics suite to your dashboard. The report compares won revenue by close date with each rep’s goal.
How do I calculate pipeline coverage in HubSpot?
Pipeline coverage is the open pipeline closing this quarter divided by the target still to reach. HubSpot has no ready-made report for it: build a custom report with a formula on Professional, or put two reports side by side on Starter.
How can I see what changed in the pipeline since last week?
Most HubSpot reports read current values only. The Historical snapshots and Deal change history reports in the Sales analytics suite show the pipeline at earlier points and what changed since.
Why does the Deals created report show the wrong person?
The ready-made Deals created report groups deals by who created them. Deals from imports, forms or integrations all land on that user. Change the report’s dimension to Deal owner.
Numbers your sales team agrees with
We check your pipeline, reports and data live in your portal. You keep the quick wins, whether we work together or not.